Microsoft Power BI - Action Plan for E-Commerce
[This blog post was originally posted in June 2017 and updated in May 2020]
For several years now, we at CSW Solutions had customers interested in taking all the data they collected over the years and make sense of it by using visualization and AI. This would allow them to understand growth, margin, and spend patterns. It was and continues to be most common with our E-commerce customers. We will shed light on the process of using Power BI as a data reporting tool and the necessary steps to get cohesive and reliable reporting with dashboards.
Power BI is a suite of business analytics tools that can deliver insights throughout an organization. By connecting Power BI to different data sources, you can generate dashboards and reports that allow you to better understand the current situation and future needs of the entire organization.
In most cases, a standard data set from a source is comprised of a single sales fact table with a few dimensions such as date, vendor, geography. However, in retail and eCommerce, things are a bit more complicated; to leverage Power BI, it is recommended to utilize a multi-step process.
This post will provide a sample process of implementing a tool like Power BI for an e-commerce business in 5 steps. These recommendations are geared toward Power BI but not limited to only Power BI.
Step 1 – Understanding the Requirements (Discovery Phase)
This step includes a series of requirements meetings with key stakeholders in the organization. These include sales, marketing, supply chain, finance, merchandising, and human resources. To start this discussion, we would start by creating a set of prototype dashboards to elicit feedback and demonstrate some of the capabilities that Power BI can provide.
Here are some examples of key performance measures and metrics that can become part of our requirements:
| Category | Requirements | Benefit |
| Sales & Margins | Provide sales and margins. Include trends, sales per SKU, store sales, DC Sales and Margin, Market Share vs. Competitors. | Real-time insight into sales and margin performance of individual stores, brands, and CSRs. |
| Financial | Overall financial results including EBITDA, Labor, Expenses, Cash Flow, Receivables, Payables, Plan vs. Actual Results. | Timely financial data helps executives and managers to keep a pulse on the overall operations and enhances the ability to respond to changes in financial results |
| Inventory | Provide Inventory/DC Key metrics and KPIs including delivery performance, defects, out-of-stock. | Optimal management of inventory balances and distribution center operations is critical to the overall performance of the business. |
| Marketing | Deliver key metrics for each website on web page views, sessions, web users, web search, Social Media engagement, campaign performance, coupon/promotion analysis, marketing spends vs. budget | Ability to visualize the impact of marketing activities and campaigns on website and in-store as well as coupon redemption and marketing ROI. |
Step 2 – Mapping the Requirements to Data Entities and Sources
The next step is to develop an entity model based on the requirements gathered in the first step.
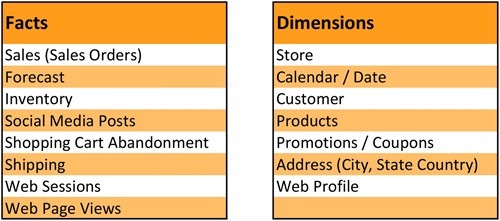
This requires us to model the data to define the data objects and their relationships. In contrast to a relational database, the goal of the data modeling is to use two types of data tables. Fact tables and dimension tables. Fact tables contain the data corresponding to a particular business process. Dimension tables contain the descriptive attributes related to each instance of the data. Fact tables and dimension tables are related to each other. Here is an example of these tables and what they may contain:

After creating the data model and entities, we need to map the relationships between the entities. This modeling can be done within the Power BI Desktop tool or in SQL Server.
After building the data schema including the tables and their relationships, each data entity needs to be traced and its associated data attributed to a data source.
Step 3 – Loading the Data
As of today, Power BI allows you to connect to a relational data source in a few different ways. This includes Import, DirectQuery, and through a Live Connection when utilizing SSAS. I will briefly discuss the advantages and disadvantages of using DirectQuery and then dive deeper into its execution to give you a solid understanding of what is going on behind the scenes.
You create a dataset automatically in Power BI when you use Get Data. With Get Data, you connect to and import data from a content pack, file, or connect to a live data source. A dataset contains information about the data source and data-source credentials. In many cases, it also includes a subset of data copied from the data source. When you create visualizations in reports and dashboards, you're often looking at data in the dataset.
A data source is where the data in a dataset comes from. For example, the data could come from:
- An online service like Google Analytics or QuickBooks
- A database in the cloud, like Azure SQL Database
- A database or file on a local computer or server in your organization
Step 4 – Creating Calculations and Measures
With Power BI, DAX (Digital Analysis Expressions) can be used to create measures and calculated columns. With larger datasets, DirectQuery will require that the creation of the calculated columns and measures be in the data source.
Below are some sophisticated columns that might be created:
- Comp Sales
- Current Year Results
- Previous Year Results
- Year-Over-Year Comparisons
- Rolling 52-week trend
- Out-of-Stock or Low Stock Conditions
- Sales by Hour
- Expenses as a Percent of Revenue
- Promotion/Coupon Performance
- Marketing Campaign Performance
Step 5 – Developing Reports and Dashboards
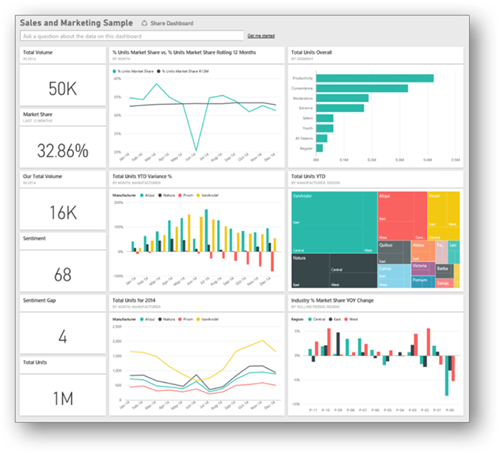
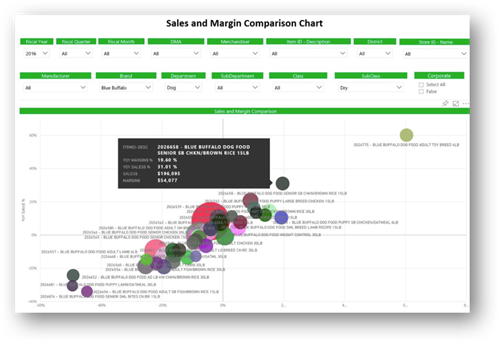
Once the necessary calculated columns and measures are developed, the next step is to create reports and dashboards to deliver key insights to the organization. Power BI provides more than 20 “out-of-the-box” visuals that can help deliver insights. Microsoft and community members also contribute Power BI visuals for the public benefit and publish them to the AppSource. You can download these visuals and add them to your Power BI reports. Microsoft has tested and approved these Power BI visuals for functionality and quality.
Here are some examples:
Ultimately, the goal of this post was to provide a sample action plan for eCommerce development and business to implement Power BI. It is easy to see that these tools provide a deeper insight into sales, operations, etc. We would recommend a multi-step process in which we analyze the requirements and build a separate data store. This unique data store would be built with your data requirements in mind and store data from multiple data sources. The data store is then connected to Power BI to create personalized reports with exclusive dashboards while monitoring data. With tools like Power BI, you can finally be on your way to a more effective method of forecasting results and managing your data in a way that works for you and your team.
![]()